visualization
Tagged photos (51)

Chitrmela forex chart with teal color and black background 2b418ec4 0c0a 4a68 b9fc 7ff7bb195848 2
by Chitrmela
Chitrmela flying composition 3d icon UI icon a chart icon bar ch 44e11170 f088 48fa 8651 25d0449404d1 3
by Chitrmela

Chitrmela DataFlow Interactive Data Science Notebook f34941b7 dc5b 44f0 a1b5 10806c4af34a 3
by Chitrmela

Chitrmela DataFlow Interactive Data Science Notebook f34941b7 dc5b 44f0 a1b5 10806c4af34a 0
by Chitrmela

Chitrmela create a data visualization of a pie chart with a heav c3759c21 799d 410e 8a37 c340f6ac431c 3
by Chitrmela
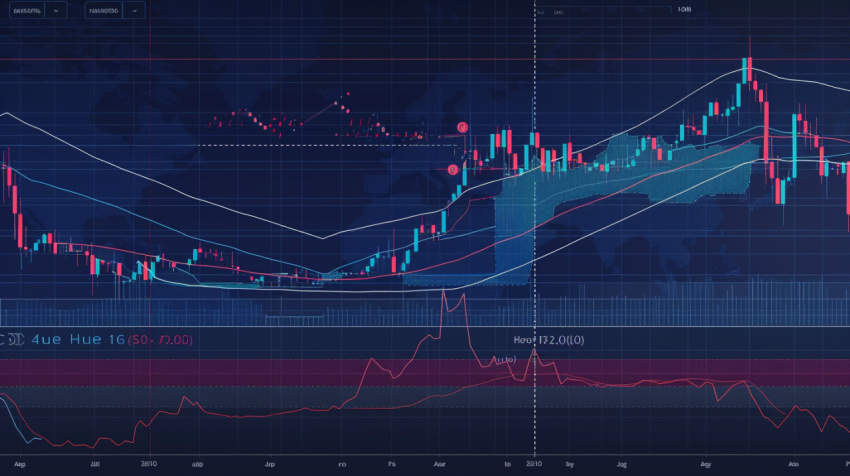
Chitrmela a techincal graph that explains what is a bullish dive 4a700051 0204 4bce 8993 1bfd3493e365 1
by Chitrmela

Chitrmela a techincal graph that explains what is a bullish dive 4a700051 0204 4bce 8993 1bfd3493e365 0
by Chitrmela
Chitrmela a nice icon for a presentation that shows a KPI benchm 7f338c45 968a 49ba bfc4 f18f97bbd536 3
by Chitrmela

Chitrmela a nice icon for a presentation that shows a KPI benchm 7f338c45 968a 49ba bfc4 f18f97bbd536 2
by Chitrmela

Chitrmela a nice icon for a presentation that shows a KPI benchm 7f338c45 968a 49ba bfc4 f18f97bbd536 1
by Chitrmela

Chitrmela a nice icon for a presentation that shows a KPI benchm 7f338c45 968a 49ba bfc4 f18f97bbd536 0
by Chitrmela

Chitrmela a flaticon of an upward trending graph using colors li d093729f cbb2 408c 9374 f73e4310b9f9 0
by Chitrmela