

Chitrmela DataFlow Interactive Data Science Notebook f34941b7 dc5b 44f0 a1b5 10806c4af34a 0
Explore charts and graphs! Visualize data.
Tags
chart graph data visualization diagram analytics statistics trends report presentation infographic dashboard analysis metrics plotSimilar Photos

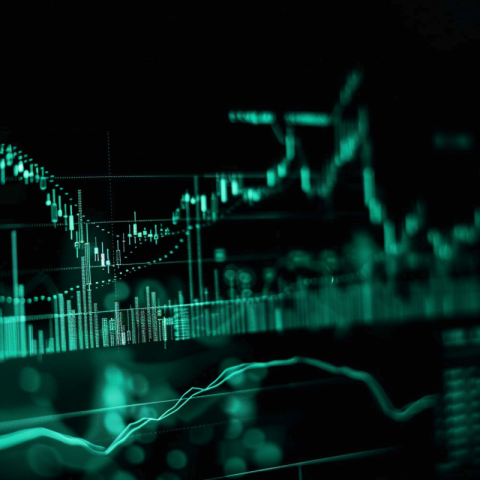
Chitrmela forex chart with teal color and black background 2b418ec4 0c0a 4a68 b9fc 7ff7bb195848 2
by Chitrmela
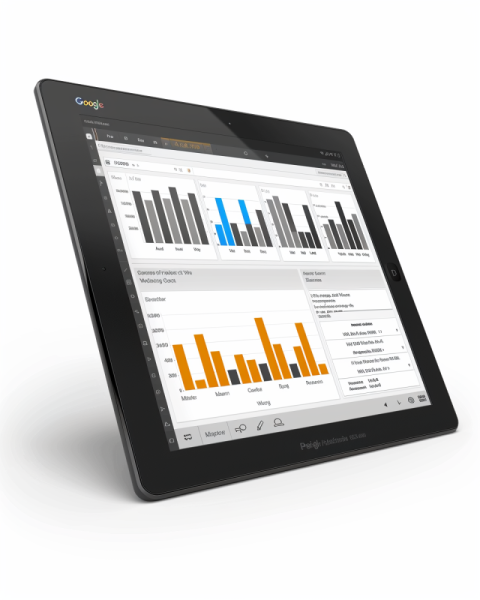
Chitrmela Google analyitics white background chaos 10 ar 45 0280ad0a 879c 431a a7b7 731d471e7e5d 2
by Chitrmela

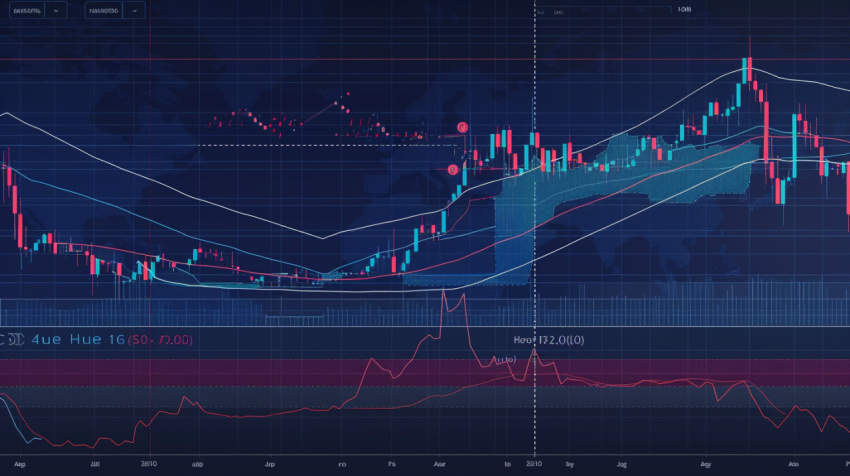
Chitrmela a techincal graph that explains what is a bullish dive 4a700051 0204 4bce 8993 1bfd3493e365 0
by Chitrmela
Chitrmela on a screen a line grapsh with green line going up and e83178db ac03 492a bb5d b08d76ba720e 0
by Chitrmela

Chitrmela a flaticon of an upward trending graph using colors li d093729f cbb2 408c 9374 f73e4310b9f9 0
by Chitrmela

Chitrmela a flaticon of an upward trending graph using colors li 24c4837b ab17 47f3 b2fc 3679dd7c75bf 0
by Chitrmela

Chitrmela a nice icon for a presentation that shows a KPI benchm 7f338c45 968a 49ba bfc4 f18f97bbd536 2
by Chitrmela

Chitrmela A bar chart showing an upward trend ar 169 28302130 789d 48f7 bab1 6c7a35da4bc5 2
by Chitrmela

Chitrmela Google analyitics white background chaos 10 ar 45 0280ad0a 879c 431a a7b7 731d471e7e5d 1
by Chitrmela
Chitrmela a nice icon for a presentation that shows a KPI benchm 7f338c45 968a 49ba bfc4 f18f97bbd536 0
by Chitrmela
-
17
-
0
-
0
License and Use
Free for commercial use Attribution required- Details
- Photo #12347
- Published on Apr 26, 2024
- Photo type PNG
- Resolution 1024x1024
- Category Business / Finance
- Subcategory Analytics
- File size 1.3MB